TV Viewing Cools Off in Nielsen’s August Gauge Reports as Sports Take a Breather and School Resumes
News Center Archive | Nielsen ·
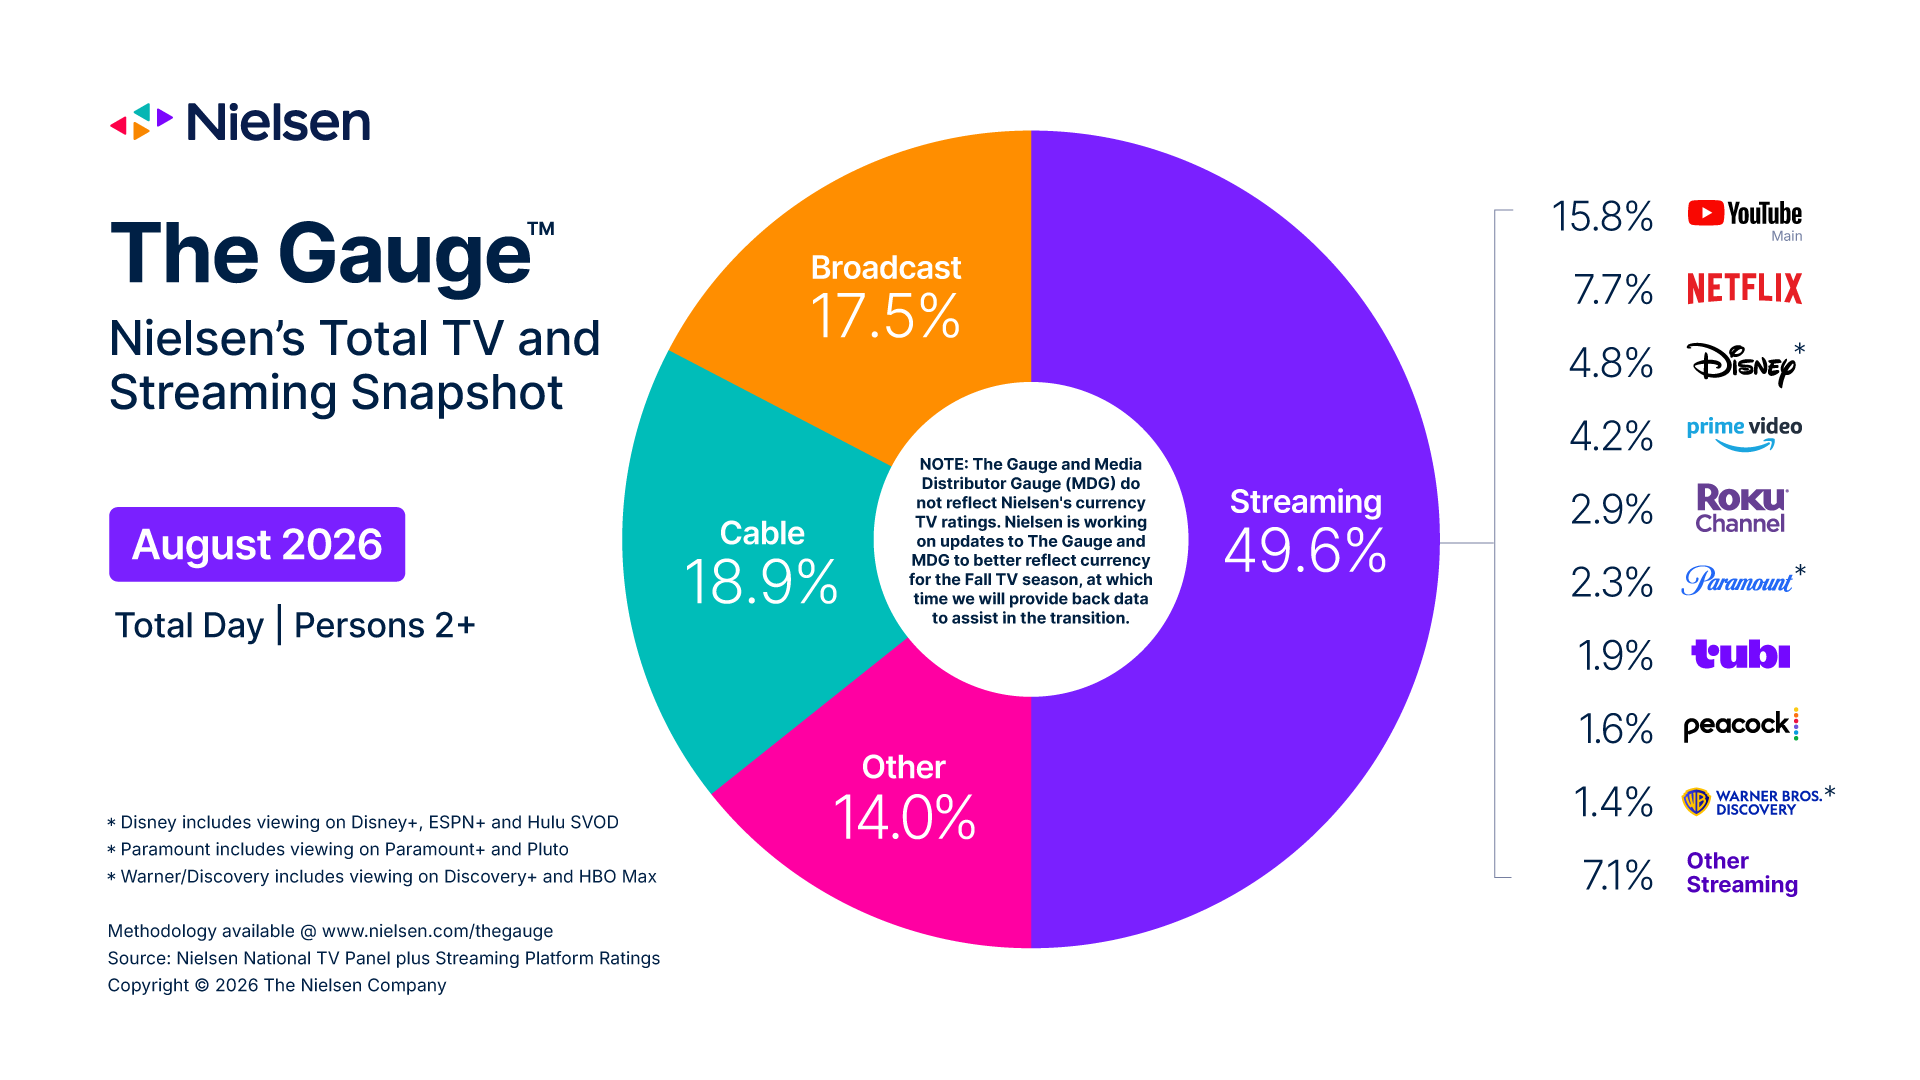
YouTube Captures 15.8% of TV, Maintains Lead Among Media Distributors Disney Returns to No. 2 Among Media... The post TV Viewing Cools Off in Nielsen’s August Gauge Reports as Sports Take a Breather and School Resumes appeared first on Nielsen .
YouTube Captures 15.8% of TV, Maintains Lead Among Media Distributors
Disney Returns to No. 2 Among Media Distributors; ‘ABC World News Tonight’ Leads Broadcast Programs, College Football on ESPN Tops Cable Telecasts
Streaming Represents 49.6% of TV Watch-Time
NEW YORK – October 22, 2026 – Television viewing cooled off in August following a two-month surge fueled by the FIFA World Cup 2026™, according to Nielsen’s August 2026 reports of The Gauge™ and Media Distributor Gauge. The quiet window between the World Cup’s July conclusion and the start of football season, coupled with the annual back-to-school viewing decline among kids and teens, contributed to a 4.4% decrease in total TV usage. However, while time spent with each Gauge category declined between July and August, cable and streaming still managed to gain share, capturing 18.9% and 49.6% of television, respectively.
Overall streaming usage was down 3.2% in August, but because the decrease was smaller than that of total TV usage (-4.4%), the category gained 0.6 share points over July. YouTube bucked the monthly downturn to capture a platform-record 15.8% of TV as monthly viewing climbed 6%, keeping the streamer in the lead in Nielsen’s Media Distributor Gauge. While viewing among 6-17 year-olds faced back-to-school headwinds, YouTube benefited from a 9% increase in viewing among adults 50 and older.
Disney Streaming and Paramount Streaming each added 0.1 share point to finish with 4.8% and 2.3% of TV, respectively. Meanwhile, Peacock dropped back to 1.6% of TV (-1.0 pt.) following the conclusions of both Telemundo’s World Cup coverage and the latest season of Love Island USA in July, but was notably up 0.2 share points compared to August 2025.
The post-World Cup lull also reshuffled the Media Distributor Gauge rankings. Disney added 0.4 share points and moved back into the No. 2 slot with 9.3% of total TV watch-time. Netflix moved up to No. 3 with 7.7% of TV, narrowly outpacing NBCU+Versant* by a margin of 0.03 share points. Paramount added 0.3 points and climbed to No. 5 with 6.8% of TV, while FOX moved to No. 6 with 5.6%.
Broadcast viewing declined 14% compared to July as the category settled into its typical August slowdown ahead of football season. The absence of the World Cup contributed to a significant drop in sports viewing, which fell to less than 9% of broadcast viewing in August compared to 30% in July. Additionally, while Hispanic audiences represented a 30% increase in broadcast viewing from May to June, and steady viewing through July, broadcast usage among Hispanic viewers declined 30% in August.
Dramas and news represented 22% and 18% of broadcast viewing, respectively. News programming led the broadcast rankings, with ABC World News Tonight topping both the program and telecast lists. Meanwhile, NBC’s NFL preseason coverage ranked sixth among broadcast telecasts, offering a preview of football’s return in September. Broadcast ultimately lost 2.0 share points to finish with 17.5% of TV.
Overall cable usage declined 3%, but the category gained 0.2 share points to represent 18.9% of total TV watch-time. Cable sports viewing rebounded with a 26% increase in August, nearly offsetting July’s 27% decline. ESPN’s coverage of the North Carolina–TCU college football matchup on August 29 topped the cable telecast rankings. News remained cable’s largest genre, accounting for 25% of its viewing, compared to 8.2% for sports.
*Because advertising sales for Versant are still retained by NBCUniversal, and to preserve data trends and insights in these reports, NBCU and Versant are reported together in the Media Distributor Gauge with each company’s respective share included in the Media Distributor Gauge chart.
Note: As previously communicated, The Gauge™, Media Distributor Gauge and Ad Supported Gauge will undergo a one-time methodology adjustment beginning with the September 2026 measurement interval to align with Nielsen’s TV currency data. We continue to work closely with clients to guide them through the methodology change, sharing further impact data and allowing additional time to evaluate the trends. Therefore, Nielsen will publish the September and October intervals together later this year.
The August 2026 interval spanned five weeks, from 07/27/2026 through 08/30/2026. Nielsen reporting follows the broadcast calendar, with weekly intervals beginning on Monday.
Lorem ipsum dolor sit amet id erat aliquet diam ullamcorper tempus massa eleifend vivamus.
Nielsen is a global leader in audience measurement, data and analytics. Through our understanding of people and their behaviors across all channels and platforms, we empower our clients with independent and actionable intelligence so they can connect and engage with their global audiences—now and into the future. Learn more at www.nielsen.com and connect with us on social media ( X , LinkedIn , YouTube , Facebook and Instagram ).
Lauren Pabst lauren.pabst@nielsen.com
The post TV Viewing Cools Off in Nielsen’s August Gauge Reports as Sports Take a Breather and School Resumes appeared first on Nielsen .